The electrocardiogram (ECG) is used to trace the electrical activity in cardiac tissue. It looks at how electrical impulses travel through the heart from various angles. It is used clinically to identify and locate pathology within the cardiac conducting system and within cardiac muscle.
This article covers the physiology underpinning ECGs, as well as explaining pathological ECG traces and how they arise. Some common, clinically relevant, ECG traces will also be covered.
The ECG leads
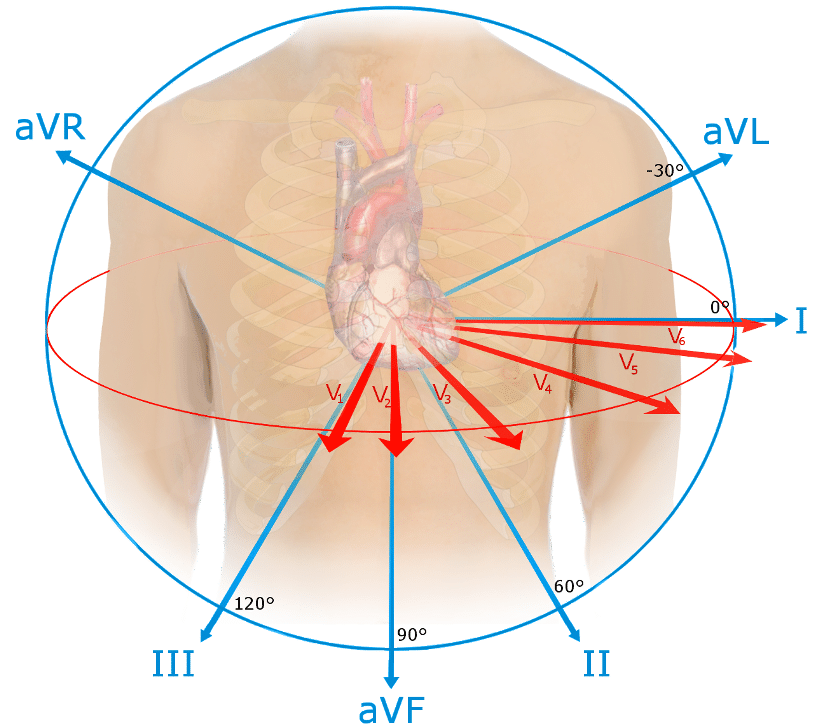
ECGs are most commonly measured using either 3 leads or 12 leads. The term ‘lead’ is slightly confusing, in that 12 lead ECGs actually only have 10 physical electrodes. These electrodes, however, generate 12 different ‘views’ of the heart. These ‘views’ are called ‘leads’.
In a 12 lead ECG there are 6 chest electrodes (V1-V6) and 4 limb electrodes. These come together to give the 12 leads, or views, of the heart. This can be useful in visualising the electrical activity of the heart from different views, and therefore to localise pathology.

Figure 1 – The 12 ‘views’ of the heart in a 12 lead ECG
The leads can also be grouped together to give ‘territories’ of the heart. These correspond to the area of the heart that they are measuring the electrical activity from and also the coronary arteries which supply it. This can be useful clinically, especially in the case of a STEMI, as is outlined later.
| Territory | Leads | Coronary Arteries |
| Inferior | II, III, aVF | Right Coronary Artery
Left Circumflex |
| Lateral | I, aVL, aVR, V5, V6 | Left Circumflex
(or branch of LAD) |
| Anterior | V3, V4 | Left Anterior Descending (LAD) |
| Septal | V1, V2 | LAD |
Reading an ECG
ECG tracings are recorded on a specific type of paper, as shown in the example below. There are certain measurements to be aware of here:
- Small square = 0.04 secs
- Large square (5 small squares) = 0.2 secs
- 5 large squares = 1 second
- 300 large squares = 1 minute
Fig 2 – The specifics of ECG recording paper
Remembering these measurements is essential in reading an ECG trace, as it allows you to calculate the rate, and also assess whether there are any abnormalities in the length of the intervals seen in the complexes. This can indicate if there are any problems with the conducting system and also localise these.
The ECG trace
The nature of the change in membrane potential, alongside the direction in which these electrical changes occur, determines the morphology of the ECG trace.
Depolarisation towards an electrode gives a positive complex (upwards) on the ECG trace, whilst depolarisation away gives a negative complex (downwards). When measuring repolarisation, the opposite is generated; repolarisation towards a node is negative, and repolarisation away is positive.
The magnitude of the complex generated depends on the direction of the electrical current and the volume of tissue involved. The more direct and higher the electrical activity, the taller the wave will be.
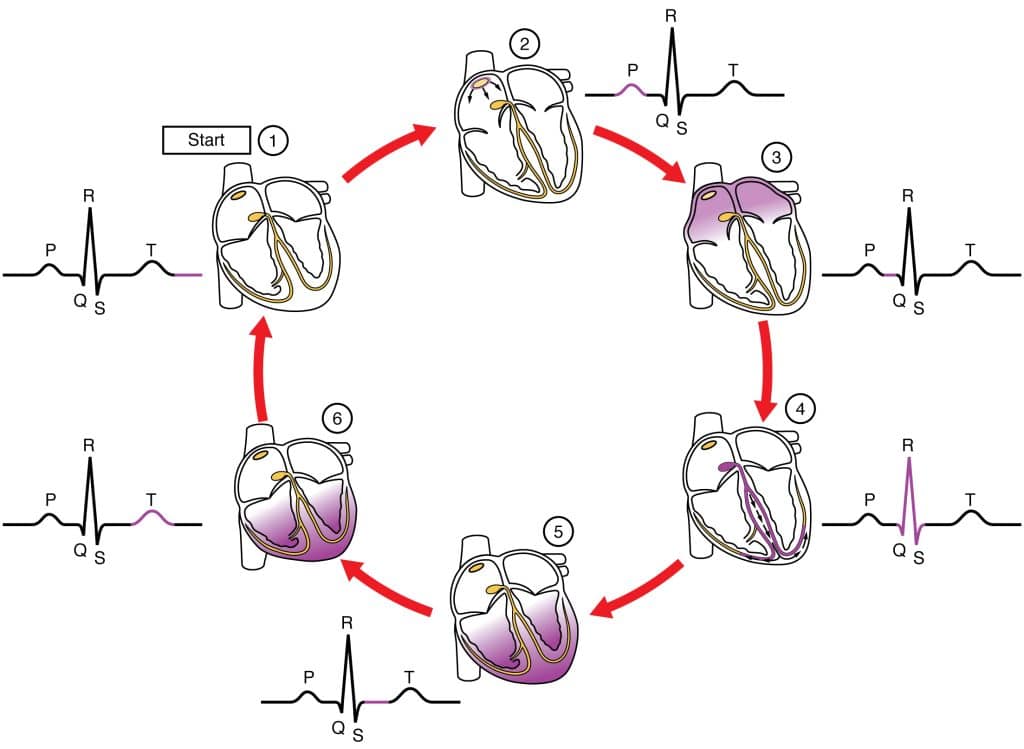
There are characteristic wave patterns found within the ECG complex for a single cardiac cycle:
Components of the ECG trace
Using figure 3 above, we will now describe the key components of the ECG trace as viewed from lead II.
P wave
This represents atrial depolarisation. As the atria are relatively small and depolarisation is moving towards the lead, this is small upwards inflection.
Q wave
This represents initial ventricular depolarisation, as the impulse spreads from the bundle of His . It is a small downwards inflection as it represents depolarisation, but the net impulse is indirectly away from the electrode.
R wave
This represents the bulk of ventricular depolarisation. The vector is directly towards lead II and represents a large mass, so gives a large, upwards inflection on the ECG.
S wave
As depolarisation spreads from the ventricular apex and turns superiorly, the S wave is generated. This is indirectly away from lead II, so despite the large mass it generates a small, downward inflection.
T wave
The T wave represents ventricular repolarisation. Repolarisation occurs away from lead II, but since the timing is dispersed as the ventricular tissue repolarises gradually, it creates a small, curved inflection.
The shape of the pattern seen on the ECG complex will vary dependent on the lead it is being viewed from. This is due the way in which the position of the lead will affect the direction from which it receives the impulse, and therefore the direction of the complex generated. Lead II is commonly used as the reference point for the ‘typical’ ECG trace.
Clinical Relevance – STEMI vs NSTEMI
The ECG is particularly useful in diagnosis of an ST elevation myocardial infarction (STEMI). A STEMI is defined as a complete occlusion of blood flow to a portion of the myocardium, resulting in ischaemia and full thickness infarction.
As the tissue dies it becomes leaky to electrolytes, leading to a partial depolarisation during the ventricular repolarisation period (ST segment). This leads to elevation of the ST segment, i.e. a STEMI.
In contrast, an NSTEMI is where there is partial occlusion of blood flow to the myocardium. This can lead to ST depression and T wave inversion, but not ST elevation. The mechanism behind this is complex and beyond the scope of this article.
The ECG is very useful in localising the region of infarction in a STEMI. There are characteristic leads which correspond to anatomical territories of the myocardium. If there is ST elevation in these particular leads it will indicate that there is infarction occurring in these regions. Using these leads the vessel most likely occluded can be identified, which is extremely useful in guiding treatment for the STEMI. This gives a useful non-invasive tool to localise pathology.

